|
|
|
|
|
|
|
|
|
|
|
Section 8.2.4
Lateral Torsional Buckling Limit State
Last Revised: 07/30/2011
As mentioned earlier, Lateral Torsional Buckling (LTB) is a strong axis phenomena. It need not be considered for weak axis bending. The equations for each of the cases shown in SCM Table User Note F1.1 are found in the Chapter F sections referenced in the table. The general form used to compute LTB effects is the same for cases F2, F3, F4, and F5. The differences are in the computation of the key quantities (Lp, Lr, Mp, and Mr, see Figure 8.2.1.5) and the details of the equations used in various buckling ranges.
Note also that web slenderness is considered in several of the LTB cases. As a result, Web Local Buckling (WLB) is integrated in the LTB equations, making WLB only a consideration for HSS and other square and rectangular tubes.
The Limit State
The basic limit state follows the standard form. The statement of the limit states and the associated reduction factor and factor of safety are given here:
| LRFD | ASD |
| Mu < fbMn | Ma < Mn/Wb |
| Req'd Mn = Mu/fb < Mn | Req'd Mn = Mu Wb < Mn |
| Mu / (fbMn) < 1.00 | Ma / (Mn/Wb) < 1.00 |
| fb = 0.90 | Wb = 1.67 |
The values of Mu and Ma are the LRFD and ASD factored loads, respectively, applied to the flexural member.
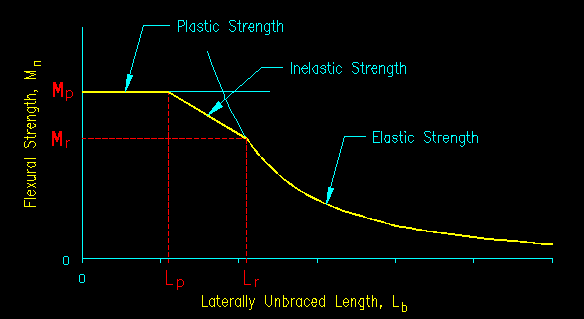
In this case Mn is the nominal LTB flexural strength of the member. Since this is a buckling phenomena, limits need to be found for the three strength regions: plastic, inelastic buckling, and elastic buckling as shown in Figure 8.2.1.5.
The General Form
The general form of the LTB limit state follows the typical buckling curves. The slenderness parameter used is Lb, the laterally unbraced length.
It is worth noting that each laterally unbraced length will have it's own Mn to be compared to the required Mn (Mu/f or WMa) on its length. This means that a beam with several laterally unbraced lengths will have a varying moment capacity along its length. This will necessitate doing the flexural strength (Mn) calculation on each laterally unbraced length!
The limits of the buckling regions are specified by the terms Lp (the limit of the plastic region) and Lr (the limit of the inelastic buckling region) as shown in Figure 8.2.1.5. The figure is repeated here as Figure 8.2.4.1 for ease of use. Hence:
if Lb < Lp then the plastic strength, Mp, controls and LTB does not occur
if Lp < Lb < Lr then inelastic LTB occurs
if Lr < Lb then elastic LTB occurs
Figure 8.2.4.1
General LTB Strength
Click on image for larger view
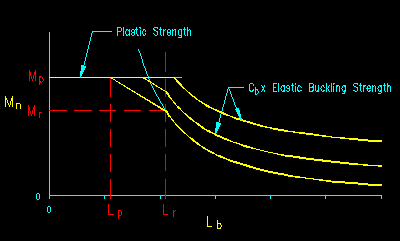
The unique factor associated with LTB is the beam has non-constant compressive stress along its length. This behavior is accounted for by the scale factor Cb. Cb shifts the LTB curve upward as illustrated in Figure 8.2.4.2. Note that there is an upper limit of Mp on all LTB strength equations. There is no condition for which a beam's strength exceeds Mp.
Figure 8.2.4.2
LTB Strength Modified by Cb
Click on image for larger view
The equations for determining Lp and Lr are found in the section of chapter F that deals with each situation. We will look at the equations as they are found in SCM F2.2.
The equation for Lp (SCM equation F2-5) is relatively simple. The equation for Lr (SCM equation F2-6), on the other hand, is quite complex. This equation has been substantially reorganized since prior versions of the specification.
Note that both Lp and Lr are functions of Fy and the member section properties. They are not functions of the member internal forces. This means that, from the section property data for rolled sections provided with the SCM, tables of Lp and Lr for each section can be created for the different material types. Such a table for I-shaped sections in ASTM A992 steel has been included in Part 3 of the SCM. This table, which includes quantities in addition to Lp and Lr, starts on SCM page 3-19. Take a look at it.
In this text, the SCM equations have been rearranged to fit the general form of the strength curves shown above. Namely, terms for Mp and Mr are extracted (where necessary) from the SCM equations for use in the general form shown in Figure8.2.4.1. The equations have been rewritten in these terms as well. The resulting equations are the same as the SCM equations with some algebraic rearrangement. This will help you to see the various sections presented in a form that will be common across the applicable SCM sections. A summary of the equations can be down loaded at the bottom of this page.
Mp
- SCM F2 & F3: The plastic moment capacity, Mp, is the plastic strength of the member computed in the yielding limit state.
- SCM F4: Mp = RpcMyc = RpcFySxc (SCM Equation F4-1).
- SCM F5: Stresses are used instead of moments in this section. Fy takes the place of Mp (extracted from SCM equation F5-3) in the general form of the equation for the inelastic buckling region. Mp in the general form becomes RpgFySxc (SCM equation F5-1)
Mr
The moment at the interface of the elastic and inelastic ranges, Mr, is found embedded in the linear interpolation function used to compute the strength in the inelastic buckling range.
- SCM F2 & F3: Mr = 0.7FySx (extracted from SCM equation F2-2)
- SCM F4: Mr = FLSxc (extracted from SCM equation F4-2)
- SCM F5: Stress is used instead of moments. Fr takes the place of Mr in the general form of the equation for the inelastic buckling region:
Fr = 0.3Fy (extracted from SCM equation F5-3)
The values for Mp and Mr can also be tabulated for given sections and materials. SCM Table 3-2 tabulates values for W shapes from which Mp and Mr can be determined with minor computation:
Mpx = (Mpx / Wb) Wb = (fbMpx) / fb
Mrx = (Mrx / Wb) Wb = (fbMrx) / fb
Now that the limits are defined, the equations for each range can be considered.
Plastic Range
As noted above, when Lb < Lp LTB does not happen. Consequently in the plastic range, Mn equals Mp.
In-elastic Buckling Range
A linear interpolating function is used to compute Mn in the in-elastic buckling range. The value resulting from the interpolation is then scaled by Cb. This value is compared with Mp to find the final Mn.
The equation can be written as:
Mn = min [Cb(Mp - (Mp - Mr)(Lb - Lp)/(Lr - Lp)), Mp]
Elastic Buckling Range
The nominal moment capacity, Mn, in the elastic range is found by computing the elastic moment that creates the critical buckling stress, Fcr, in the compression flange.
Mn = min[FcrSxc, Mp]
A modified Euler type function is used to the compute the critical buckling stress, Fcr.
For SCM sections F2, F3, and F4, Fcr is computed with the equation:
Where the difference between SCM chapter F sections is the computation of "r".
- SCM F2 & F3: "r" is computed using SCM equation F2-7.
- SCM F4: The equation for "r" differs based on how the section is configured.
- For SCM F5 the equation for Fcr (SCM equation F5-9) is similar but different from the one used in F2, F3, and F4. It is similar in that it is also a form of the Euler buckling equation.
Suggested Procedure for Computing Mn
To minimize hand computations, the following procedure is recommended for computing the nominal moment capacity Mn for each laterally unbraced length on a flexural member.
Locate the unbraced lengths on the flexural member
For each laterally unbraced length
Compute Mp, Lp
If (Lb < Lp) then
Mn = Mp
Else
Compute Mr, Lr
If (Lb < Lr) then
Mn = min [Cb(Mp - (Mp - Mr)*(Lb - Lp)/(Lr - Lp)), Mp]
Else
Mn = min[FcrSxc, Mp]
End if
End if
Next laterally unbraced length
AISC LTB Curves
SCM Table 3-10 (SCM page 3-99 through 3-142) provides graphs of LTB strength curves for standard W-shapes, with Cb = 1 and Fy = 50 ksi. SCM Table 3-11 provides similar curves for channel sections. These tables are useful in selecting sections for a given required moment and laterally unbraced length. These tables are not useful for other values of Fy and must be used with caution for other values of Cb. These tables are easily replaced by creating a spreadsheet which is not constrained by values of Fy and Cb. See the spreadsheet provided in the summary below. With a little added programming a search algorithm can be written within the spreadsheet to find the lightest available section which satisfies the flexural criteria.
Summary
- Download a summary of LTB requirements here.
- Download a spreadsheet example that produces the LTB curve for any W shape.
The following spreadsheet example computes the major axis flexural capacity, Mnx, including LTB effects, for a typical W section. The input values are in the grey shaded cells and the result in the yellow highlighted cell.
| Lateral Torsional Buckling | ||||||||
| Section | W18x35 | |||||||
| Steel: | A992 | Fy | 50 | ksi | ||||
| Lb | 15.0 | ft | ||||||
| Cb | 1.2 | |||||||
| Tabulated Section Properties | Computed Section Quantities | |||||||
| d | 17.7 | in | c | 1 | ||||
| tf | 0.425 | in | rts | 1.51 | in | |||
| Sx | 57.6 | in^3 | ho | 17.3 | in | |||
| Zx | 66.5 | in^3 | ||||||
| ry | 1.22 | in | Lp | 51.7 | in = | 4.3 | ft | |
| Iy | 15.3 | in^4 | Lr | 148.6 | in = | 12.4 | ft | |
| Cw | 1140 | Mp | 3325 | in-k = | 277.1 | ft-k | ||
| J | 0.506 | in^4 | Mr | 2016 | in-k = | 168.0 | ft-k | |
| Cb | Actual Mnx | |||||||
| (ft-k) | ||||||||
| 1 | 121.45 | |||||||
| 1.2 | 145.7 | <---- Answer | ||||||

