| Overview |
| IL for Reactions |
| IL for Shear |
| IL for Moment |
| Summary |
| Homework Problems |
| Report Errors or Make Suggestions |
Section IL.4
Qualitative Moment Influence Lines
Last Revised: 02/17/2026
Unlike the influence lines for reactions, there are technically an infinite number of locations along that beam for which moment influence lines can be derived as we saw in the discussion on shear influence lines. As with shear, typically a few strategic locations are sufficient to identify where to place moveable loads.
The influence line is found by figuratively putting a hinge at the point of interest and forcing a unit rotation as shown. This will force the hinge up and a “deflection” diagram is sketched. Note that the moment influence line will have same positive and negative ranges when looking at anywhere in middle of each span. This will change as you get closer to support “B”.
Figure 8 shows the influence line for moment at X1 on the left span and the associated loading diagrams for maximum positive and negative moments at X1. It may be observed that, for moment influence lines, complete spans are loaded.
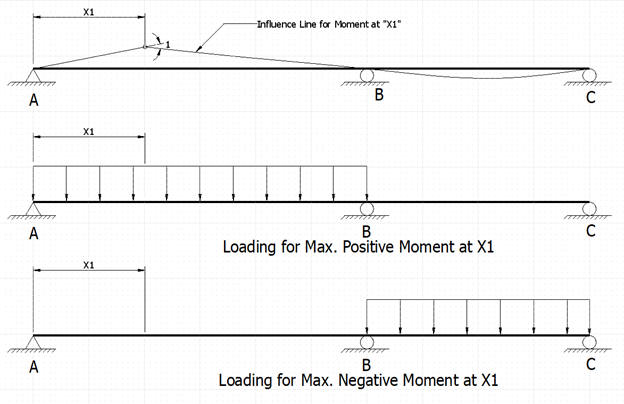
Figure 8: Influence Line and Loading for Moment at X1
Figure 9 shows the influence line for moment at X2 on the right span and the associated loading diagrams for maximum positive and negative moments at X2. Note that the resulting load diagrams are the same ones found for moment at X1, however the loading that causes maximum positive moment at X1 causes maximum negative moment at X2. There are only two unique load diagrams to define the upper and lower bounds on moment for the spans.
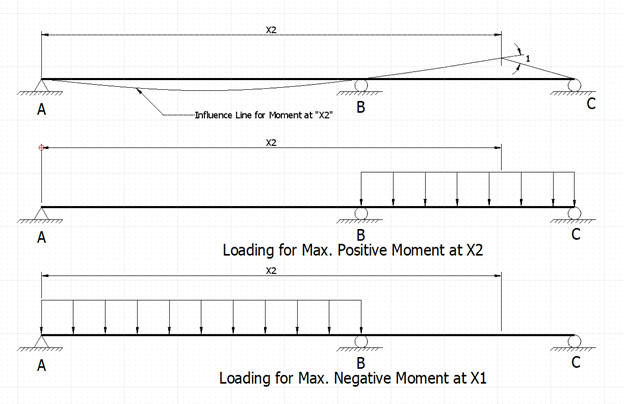
Figure 9: Influence Line and Loading for Moment at X2
Figure 10 shows the moment influence lines for moment at support “B”. Note that there is no load case that creates positive moment at “B”. The maximum negative moment at an interior support of a continuous beam will always have full load on the two adjacent spans.
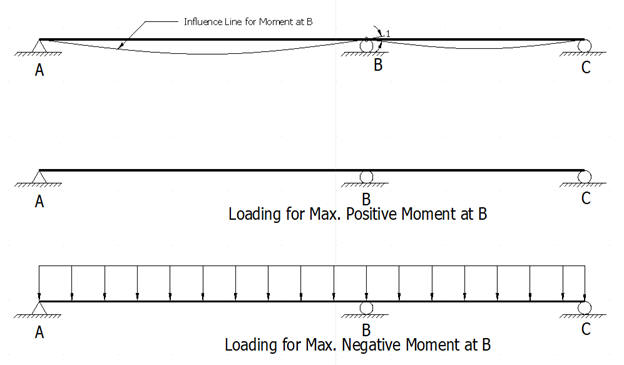
Figure 10: Influence Line and Load for Moment at Support "B"
Figure 11 extends the discussion to a multistory continuous frame. This example uses the same basic principles presented for the continuous beam. To draw the influence line for moment at point “A”, a hinge is placed at “A” and a unit rotation is imposed. The associated deflection diagram is sketched. The deflected shape is the influence line. The two load diagrams are the load diagrams for the loads that would cause maximum positive/negative moment at “A”
Note that, when drawing quantitative influence lines, the magnitude of the influence line decreases dramatically the further the load point is from the point of interest. In other words, the load on the top level in Figure 11 will have a smaller contribution to the moment at “A” than say a loading on the span itself or an adjacent span. This can be verified by loading the top level only and determining the moment at “A” by performing the structural analysis.
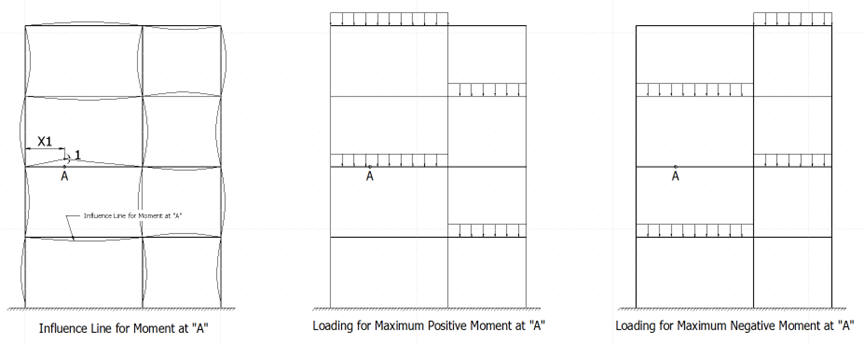
Figure 11: Influence Line and Loading for Moment at "A"