|
|
Section 6.1
Buckling Basics
Last Revised: 07/30/2011
Up to this point, we have dealt with members and components in tension. Tension has the benefit of causing a structural element to straighten. As we move the discussion to compression, we find that the strength of members may be compromised by buckling.
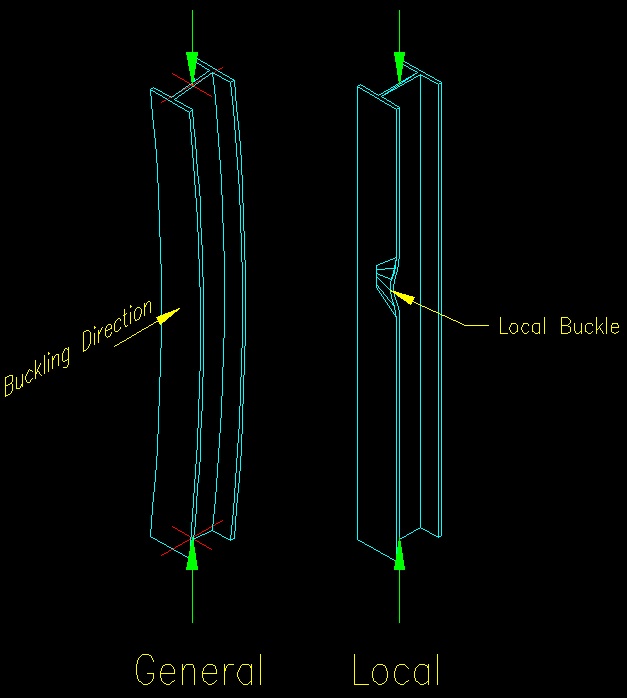
There are two main modes of buckling failure that may be experienced by steel members: Overall (or general) buckling and local buckling. Figure 6.1.1 illustrates the difference between the two modes.
General buckling is characterized by a distorted, or buckled, longitudinal axis of the member. In local buckling, the axis of the member is not distorted, but the strength of the cross section is compromised by the buckling of a component of the cross section.
Figure 6.1.1
General vs. Local Buckling
Click on image for larger view
As learned in mechanics, the Swiss mathematician Leonhard Euler developed an equation that predicts the critical buckling load for a straight pinned end column. The equation is:
Pcr = p2EI/L2
Dividing by the area of the element, we get an equation for the critical buckling stress:
scr= p2E/(L/r)2
Where the member cross sectional dependent term (L/r) is referred to as the "slenderness" of the member.
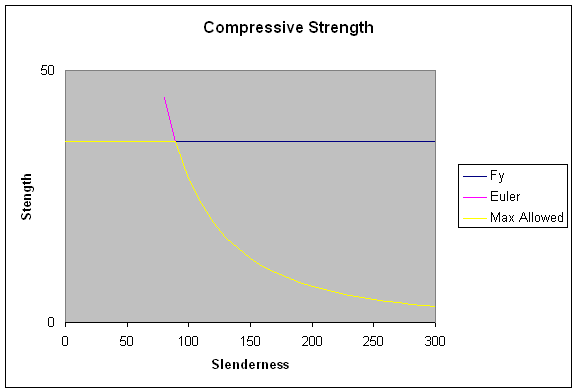
Graphing Euler's equation shows that the predicted buckling stress gets quite large for small values of slenderness. At these levels, the critical buckling stress exceeds the capacity of the material to handle it (Fy), so the limiting strength becomes the material strength instead of buckling. The equation for maximum compressive stress then becomes:
smax = minimum[p2E/(L/r)2, Fy]
This relationship is graphed in Figure 6.1.2.
Figure 6.1.2
Theoretical Maximum Compressive Stress
Click on image for larger view
Experimental data shows that the above lines are UPPER limits of actual member strength. The data also shows that the transition from plastic (i.e. smax = Fy) behavior to elastic (smax = euler stress) is not as clean as shown above. The transition contains characteristics of both plastic and elastic behavior. As a result the transition range is often referred to as the "inelastic" range.
Several methods for approximating strength in the inelastic range have been used for different materials over the years. However, for purposes of discussion, a linear transition will be used here. In the SCM slenderness values at the transition points are known as lp and lr. These values are shown on Figure 6.1.3.
The strength values associated with these points we will call sp and sr. (Note that you will not find these terms in the SCM.)
Figure 6.1.3
Theoretical Maximum Compressive Stress
Click on image for larger view
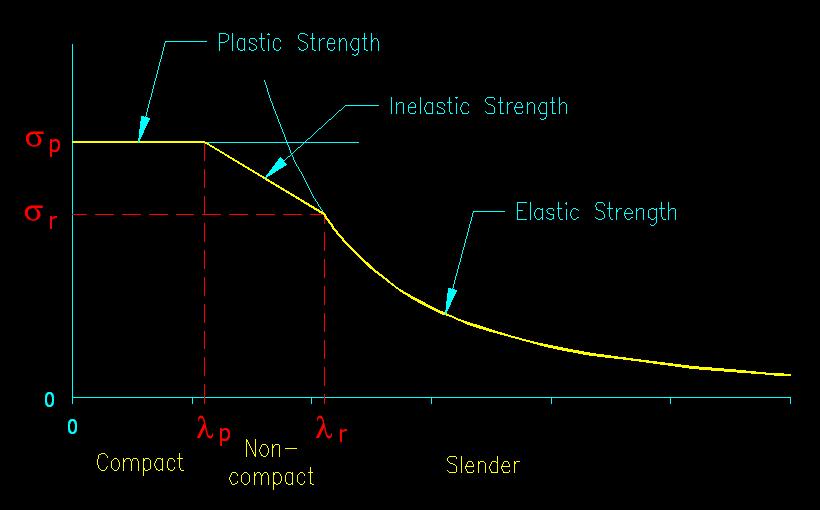
The graph in Figure 6.1.3 is the typical strength curve associated with both general and local buckling behavior.
As can be seen in Figure 6.1.3, there are three distinct regions on the strength curve when buckling is a possibility. In the case of general buckling the ranges are known as the PLASTIC, INELASTIC, and ELASTIC ranges. When the member slenderness (L/r) is low then plastic behavior is expected and the member strength is limited by plastic strength of the material sp. When the member slenderness is in the transition range, then inelastic behavior and member strength is a combination of plastic and elastic strength. Finally, when member slenderness is large then elastic buckling behavior is expected and the strength of the member is controlled by Euler buckling behavior.
For the case of local buckling (as discussed in the next section) the slenderness is based on width/thickness ratios of the slender plate elements that make up the cross section of most steel members. The member cross sections are then classified by which of the three ranges their most slender element falls in. If the most slender cross sectional element is not very slender (i.e. b/t is small) , then the cross section is said to be COMPACT. If the most slender element of the cross section falls in the transition range, then the cross section is said to be NON-COMPACT. Otherwise, when the most slender cross sectional element is very slender (i.e. b/t is large) then the cross section is said to be SLENDER.
The SCM equations for member compressive strength include consideration for both the general and local buckling cases.